Technical view: Gold is glittering again! Can it break 4-month highs near $1875?
There’s no beating around the bush: Gold’s performance through Q4 of last year and Q1 of this year was immensely disappointing for precious metal bulls. Despite political uncertainty, rising bond yields, a falling US dollar, and hints of inflation amidst unprecedented economic stimulus across the globe, gold steadily fell until eventually forming a double bottom beneath $1700 in March.
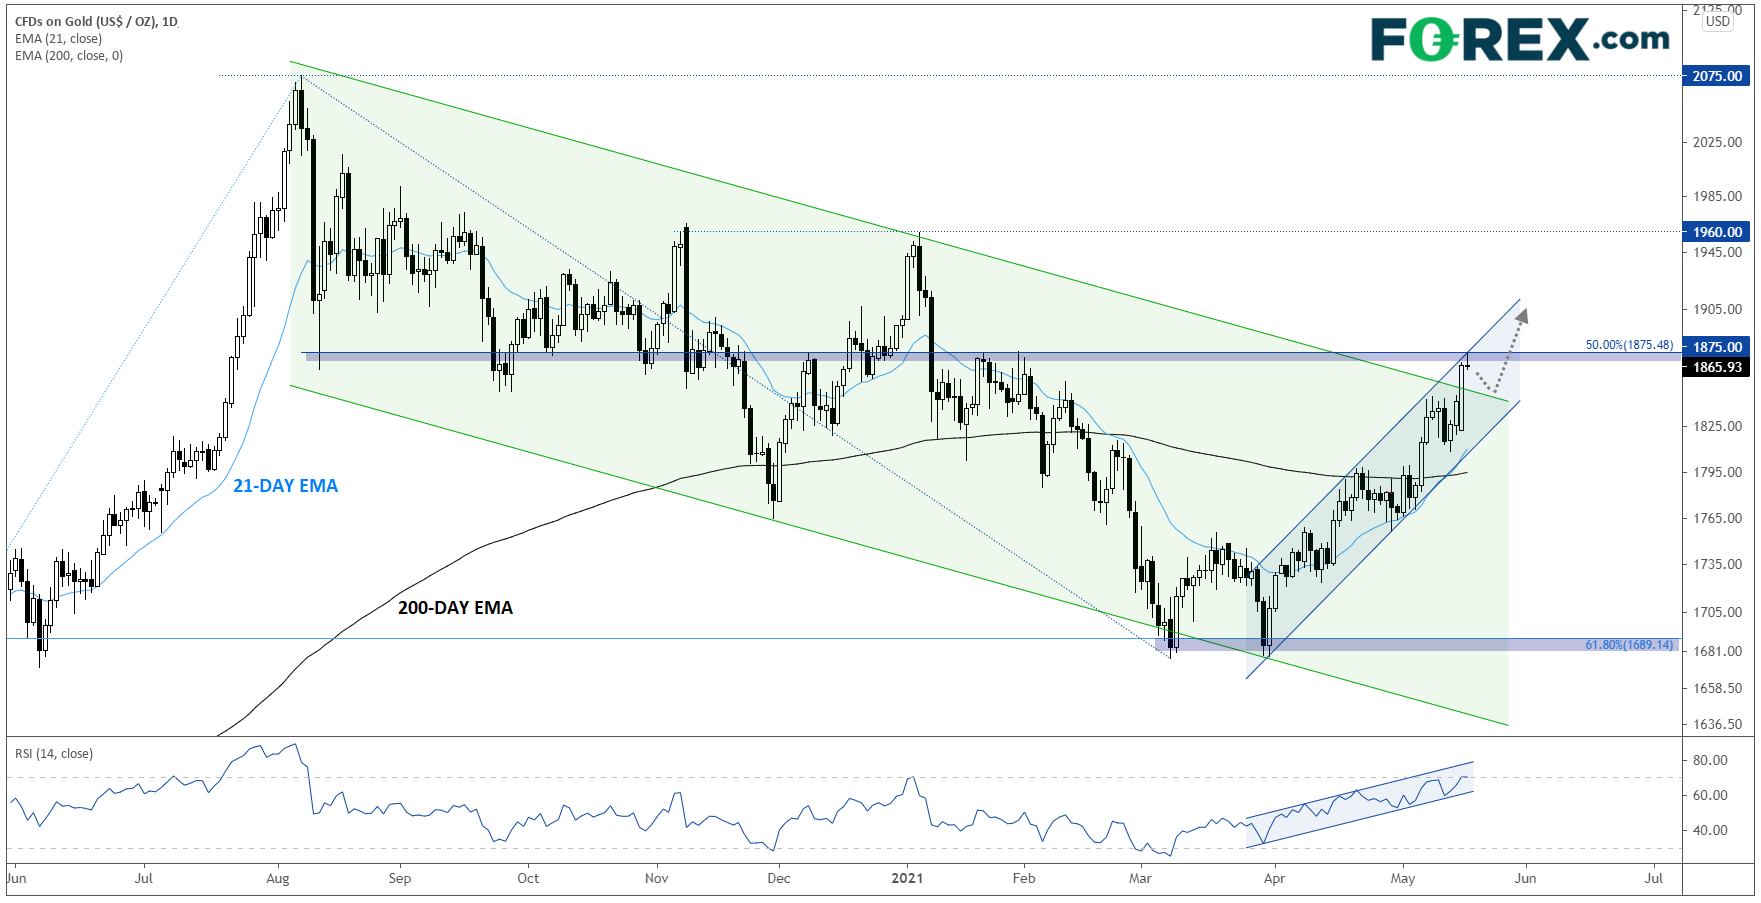
Just when even the most hardcore of gold bugs was losing faith, the yellow metal has quietly formed a bullish channel over the last six weeks. Over that same period, the 14-day RSI indicator has formed a bullish channel of its own, signaling growing buying pressure behind the move and the potential for it to extend further in the weeks to come:

Source: StoneX, TradingView
Looking at the key levels to watch, gold is testing the $1875 area, the 50% Fibonacci retracement of the pullback from last year’s record highs; this area also marks the minor highs from late January, providing a confluence of resistance levels and increasing the odds of a potential pullback in the latter half of this week.
That said, the medium-term momentum has clearly shifted back in favor of the bulls, with the 20-day EMA providing support and the 200-day EMA turning higher for the first time in months. A confirmed break of $1875, if seen, could open the door for a continuation toward the next level of previous resistance at $1960 or key psychological resistance at $2000. Only a break below the bottom of the bullish channel and the 200-day EMA in the $1800 area would erase the near-term bullish bias.
How to trade with FOREX.com
Follow these easy steps to start trading with FOREX.com today:
- , or if you’re already a customer.
- Search for the pair you want to trade in our award-winning platform.
- Choose your position and size, and your stop and limit levels.
- Place the trade.

